Fire protection systems are often viewed as a cost burden—an expense that must be borne to meet code requirements. However, this perspective overlooks the substantial financial benefits these systems provide. A properly designed and maintained fire protection system is not a cost; it is an investment that can save lives, protect property, and reduce long-term operating costs[1].
This guide provides a framework for conducting a cost-benefit analysis of fire protection systems, helping building owners and facility managers make informed decisions.
◆ Section 1: The True Cost of Fire
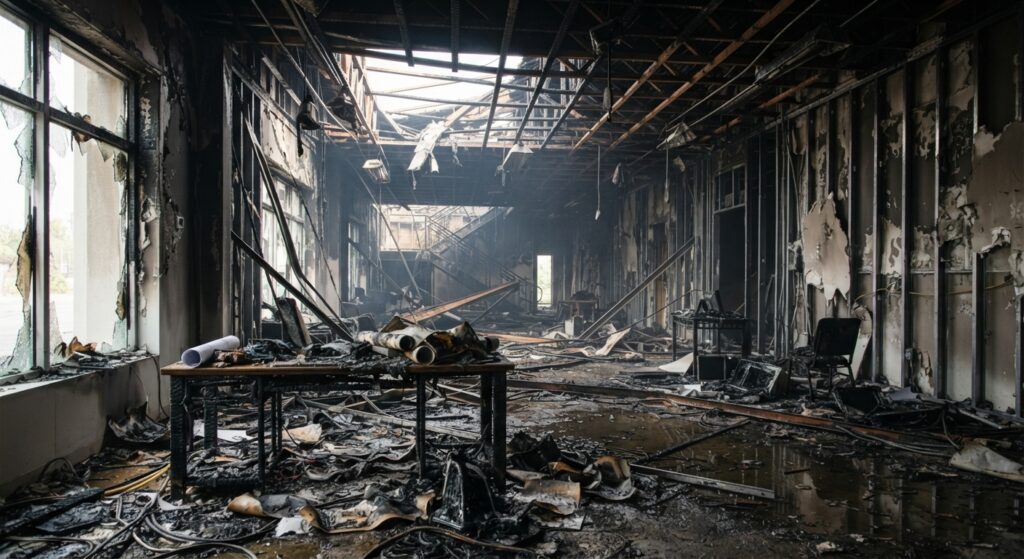
Before evaluating the cost of protection, it is essential to understand the cost of not having protection. The financial impact of a fire can be devastating.
| Cost Category | Examples |
|---|---|
| Direct Property Damage | Structural damage, equipment loss, inventory destruction[1]. |
| Business Interruption | Lost revenue during closure, temporary relocation costs[1]. |
| Insurance Premium Increases | Higher premiums after a claim[2]. |
| Legal Liability | Lawsuits from injured occupants or neighboring properties[1]. |
| Regulatory Fines | Penalties for code violations[2]. |
| Reputation Damage | Loss of tenant and customer confidence[1]. |
| Human Cost | Injury or loss of life[1]. |
Pro Tip: The average commercial fire can result in losses exceeding $100,000. For larger buildings, losses can easily reach millions of dollars[3].
◆ Section 2: The Components of a Cost-Benefit Analysis
A comprehensive cost-benefit analysis considers both the costs (investment) and the benefits (savings and avoided losses) of fire protection systems[4].
A. Costs (Investment)
| Cost Category | Examples |
|---|---|
| Initial Installation | Equipment, materials, labor, engineering[5]. |
| Ongoing Maintenance | Inspections, testing, repairs, replacement of components[5]. |
| Training | Staff training on extinguishers, alarms, and evacuation procedures[6]. |
| Administration | Documentation, record keeping, and compliance management[6]. |
| Insurance Premiums | Reduced premiums after installation (benefit). |
B. Benefits (Savings and Avoided Losses)
| Benefit Category | Examples |
|---|---|
| Reduced Property Damage | Limited fire spread and structural damage[1]. |
| Reduced Business Interruption | Faster reoccupancy and reduced downtime[1]. |
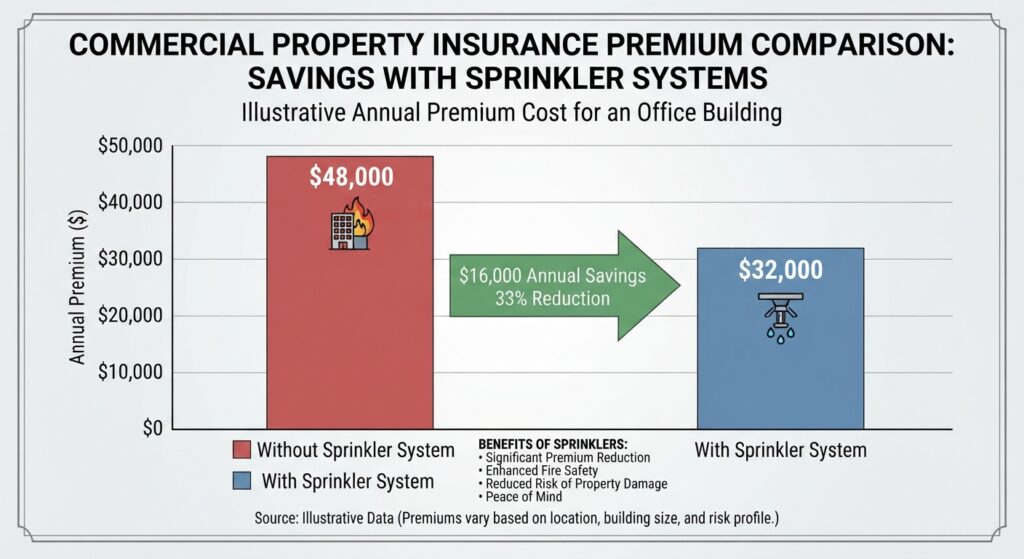
| Lower Insurance Premiums | Discounts for fire protection systems (10-30%)[2][7]. |
| Reduced Liability | Lower legal risk and fewer lawsuits[1]. |
| Code Compliance | Avoided fines and penalties[2]. |
| Tenant Attraction and Retention | Higher occupancy rates and rental premiums[8]. |
| Reduced Human Cost | Protection of employees, tenants, and visitors[1]. |
◆ Section 3: Quantifying the Benefits
Quantifying the benefits of fire protection systems requires a combination of data and reasonable assumptions[4][9].
A. Insurance Premium Reductions
Insurance companies offer significant discounts for buildings with fire protection systems[7].
| System | Typical Premium Reduction |
|---|---|
| Automatic Sprinklers | 10-30% |
| Fire Alarm Systems | 5-15% |
| Fire Extinguishers | 2-5% |
| Combination (Sprinklers + Alarms) | 25-40% |
Example Calculation:
-
Annual insurance premium without sprinklers: $50,000
-
Premium reduction with sprinklers (20%): $10,000
-
Annual savings: $10,000
B. Property Protection Value
According to NFPA research, sprinklers reduce property damage by 70% in buildings where they are installed[10].
Example Calculation:
-
Estimated potential fire loss without sprinklers: $1,000,000
-
Loss with sprinklers (30% of potential): $300,000
-
Avoided loss: $700,000
C. Business Interruption Savings
A fire can shut down a business for weeks or months. Sprinklers can significantly reduce downtime[1].
Example Calculation:
-
Daily revenue: $10,000
-
Estimated downtime without sprinklers: 30 days
-
Estimated downtime with sprinklers: 5 days
-
Savings: $250,000
D. Tenant Attraction and Retention
Fire-protected buildings are more attractive to tenants. A survey by the National Multifamily Housing Council found that 75% of tenants consider fire safety features when choosing a property[8]. Tenants may pay a premium of 5-10% for buildings with advanced fire protection.
E. Human Life Value
While difficult to quantify, the value of a human life is recognized in court settlements and insurance claims. The average wrongful death settlement in commercial fire cases can exceed $1 million[1].
◆ Section 4: Payback Period Calculation
The payback period is the time it takes for the savings from a fire protection system to offset its cost[4][9].
Formula:
Payback Period = Total System Cost ÷ Annual Savings
Example Calculation:
-
Total cost of sprinkler system: $200,000
-
Annual insurance savings: $10,000
-
Annual property protection value: $50,000 (amortized)
-
Annual savings: $60,000
-
Payback Period: $200,000 ÷ $60,000 = 3.3 years
Pro Tip: A payback period of 5 years or less is generally considered a good investment[4].
◆ Section 5: The Business Case for Different Systems
A. Fire Sprinkler Systems
| Cost Element | Typical Cost |
|---|---|
| Installation (per sq ft) | $3-$7 |
| Annual Maintenance | $0.50-$1.00 per sq ft |
| Insurance Savings | 10-30% |
| Property Protection | 70% reduction in damage |
Key Benefit: Sprinklers are the most effective fire protection system, with an average payback period of 3-5 years[10].
B. Fire Alarm Systems
| Cost Element | Typical Cost |
|---|---|
| Installation (per sq ft) | $2-$5 |
| Annual Maintenance | $0.25-$0.50 per sq ft |
| Insurance Savings | 5-15% |
| Early Warning | Provides time for evacuation and response |
Key Benefit: Early detection can significantly reduce evacuation time and property damage[11].
C. Fire Extinguishers
| Cost Element | Typical Cost |
|---|---|
| Purchase (per unit) | $100-$500 |
| Annual Maintenance | $50-$100 per unit |
| Insurance Savings | 2-5% |
| First Line of Defense | Can extinguish small fires before they spread[3] |
Key Benefit: Extinguishers are a low-cost investment that can prevent small fires from becoming large ones[3].
D. Integrated Systems
| System | Cost | Benefit |
|---|---|---|
| Sprinklers + Alarms | High | Maximum protection and insurance savings[5] |
| Sprinklers + Extinguishers | Medium | Comprehensive coverage[5] |
| Alarms + Extinguishers | Low | Basic protection[5] |

◆ Section 6: Life Cycle Cost Analysis
A more comprehensive approach is the life cycle cost analysis, which considers the total cost of ownership over the system’s useful life (typically 20-30 years)[4][9].
Life Cycle Cost Components:
| Component | Description |
|---|---|
| Initial Capital Cost | Design, equipment, installation[5]. |
| Annual Operating Costs | Maintenance, inspections, testing, repairs[5]. |
| Replacement Costs | Replacement of components at the end of their service life[5]. |
| Energy Costs | Any additional energy consumption from the system. |
| Insurance Costs | Annual premiums (reduced by the system)[2]. |
| Residual Value | Any value remaining at the end of the analysis period. |
Pro Tip: A life cycle cost analysis often reveals that the long-term savings from a fire protection system significantly outweigh the initial investment[4].
◆ Section 7: Common Mistakes and How to Avoid Them
| Mistake | Why It’s a Problem | How to Fix |
|---|---|---|
| Ignoring the “avoided loss” benefit | Underestimates the value of protection[1]. | Include avoided property damage and business interruption in your analysis. |
| Using outdated cost estimates | Leads to inaccurate calculations[4]. | Use current market rates and quotes. |
| Not considering insurance savings | Misses a significant benefit[2]. | Contact your insurance broker for exact premium reduction figures. |
| Focusing only on initial cost | Ignores long-term benefits[4]. | Conduct a life cycle cost analysis. |
| Overlooking maintenance costs | Underestimates long-term cost[5]. | Include annual maintenance in your analysis. |
| Not factoring in human life value | Underestimates the true cost of fire[1]. | Include a qualitative assessment of life safety. |
◆ Section 8: A Simple Framework for Building Owners
Here is a step-by-step framework for building owners to assess the business case for fire protection systems:
| Step | Action | |
|---|---|---|
| 1 | Identify Your Risks | Assess the fire hazards in your building[1]. |
| 2 | Estimate Potential Losses | Calculate the potential cost of a fire without protection[1]. |
| 3 | Determine System Costs | Get quotes for system installation and maintenance[4]. |
| 4 | Calculate Insurance Savings | Contact your insurance provider for premium reduction estimates[2]. |
| 5 | Calculate Payback Period | Divide total cost by annual savings[4]. |
| 6 | Conduct a Life Cycle Cost Analysis | Consider costs and benefits over the system’s life[4]. |
| 7 | Make a Decision | Invest in systems with a clear positive business case[4]. |
◆ Section 9: Summary of Benefits
| Benefit | Quantifiable? | Example |
|---|---|---|
| Reduced Property Damage | Yes | 70% reduction in damage[10]. |
| Reduced Business Interruption | Yes | Faster reoccupancy[1]. |
| Lower Insurance Premiums | Yes | 10-30% savings[2]. |
| Reduced Liability | Partially | Fewer lawsuits[1]. |
| Code Compliance | Yes | Avoided fines[2]. |
| Tenant Attraction | Partially | Higher occupancy[8]. |
| Protection of Human Life | Qualitative | Priceless[1]. |

◆ Conclusion
The cost-benefit analysis of fire protection systems is not just a financial exercise—it is a business imperative. A well-protected building is a safer, more profitable, and more resilient asset.
Take Action Today:
-
Identify the fire risks in your building.
-
Estimate potential losses without protection.
-
Calculate the payback period for different systems.
-
Make the case to building owners and stakeholders.
Continue Reading from Our Series:
-
Read more about: How to Train Employees for Fire Emergencies
-
Learn more: How to Conduct a Fire Safety Audit
-
Related guide: Commercial Building Fire Safety Plan: Development and Implementation
References & Notes:
[1] NFPA, “The Economic Impact of Fire,” 2020.
[2] Insurance Services Office (ISO), “Fire Protection and Insurance Premiums,” 2022.
[3] National Fire Protection Association, “Fire Loss in the United States,” 2021.
[4] NFPA 101, Life Safety Code, 2012 Edition.
[5] NFPA 13, Standard for the Installation of Sprinkler Systems.
[6] NFPA 10, Standard for Portable Fire Extinguishers.
[7] FM Global, “Property Loss Prevention Data Sheets,” 2021.
[8] National Multifamily Housing Council, “Tenant Preferences and Fire Safety,” 2020.
[9] U.S. General Services Administration, “Life Cycle Cost Analysis Guide,” 2022.
[10] National Fire Protection Association, “Sprinkler Effectiveness,” 2021.
[11] NFPA 72, National Fire Alarm and Signaling Code.